Standard & Poor's 500 Valuation: Where Does the Market Stand Right Now?
Investors should develop the habit of assessing whether the current market valuation is overvalued, fairly valued, or undervalued when investing their hard-earned capital in the stock market. When a market valuation is considered overvalued, it does not necessarily suggest an imminent collapse. Similarly, when a broad market is considered undervalued, it does not guarantee an immediate bottom. However, this valuation indicator can provide investors a big picture of the risk-reward ratio of the market they are considering investing in.
- P/E ratio > 20: Market considered overvalued
- P/E ratio 15-20: Market considered fairly valued
- P/E ratio < 15: Market considered undervalued
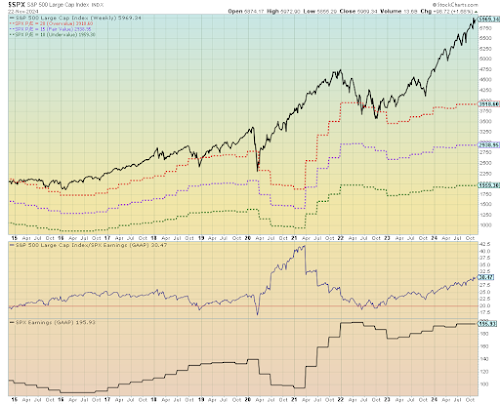
- The Top Chart shows the S&P 500's price movement (black line). The index has grown significantly, starting around 2000 points and reaching nearly 6000 points. There are notable dotted lines representing different valuation levels (overvalued, fair value, and undervalued zones).
- The Middle Chart shows the Price-to-Earnings ratio over time (blue line). Current P/E ratio is shown as 30.47.
- The Bottom Chart shows S&P 500 earnings (GAAP) over time (black line). It demonstrates the overall growth in corporate earnings since 2015. The current earnings value is shown as 195.93
The overall trend shows that despite significant volatility (especially during 2020), the S&P 500 has experienced substantial growth over this period, with both price and earnings reaching new highs by late 2024. The market appears to be trading at relatively high valuations based on the current P/E ratio of 30.47, which is well above historical averages. In contrast, periods of low P/E ratios, such as during the 2008 financial crisis (when the P/E ratio dropped below 10) and the aftermath of the 2003 dot-com bubble, reflected times of heightened investor pessimism and significant market corrections. During these times, valuations fell well below historical norms, offering rare opportunities for long-term investors willing to navigate the uncertainty.
Final Thoughts
Is this the right time to be aggressive in investing in the US stock market? I'll leave that to your judgment, but understanding these valuation metrics can help inform your investment decisions.While current market valuations suggest caution, remember that timing the market perfectly is nearly impossible. Instead of trying to predict short-term market movements, the best investment strategy is often one that you can stick with through market cycles while maintaining a long-term perspective aligned with your financial goals.
Disclaimer
This article is for informational purposes only and should not be considered financial advice. Markets are complex and unpredictable, and various factors beyond valuation metrics can influence future performance. Always conduct your own research or consult with a financial advisor before making investment decisions. Past performance does not guarantee future results.
1. S&P 500 Benchmark index tracks 500 large cap US stocks, representing 80% of market capitalization.
2. The P/E ratio indicates how expensive the market is relative to earnings. Think of the P/E ratio as the number of years it would take for the company to earn back your investment, assuming the earnings stay consistent. The higher the P/E ratio, the longer it would take to “recoup” your investment. For instance, a P/E of 30 would mean it would take 30 years to earn back your investment based on current earnings. Example: if the company earns $5 per share annually, and the stock costs $150 to acquire, it would take you 30 years to get back your initial $150 investment purely through earnings (assuming no change in the earnings or price)


Comments
Post a Comment